Integrated, flexible, accurate risk profiling at no cost


Rewatch Our Webinar
On Wednesday 14th December 1:00 – 2:00 pm, we hosted our annual platform webinar. In which we discussed the core points of the report.

Market Overview
Assets on advised platforms grew by over 15% from £618bn to £717bn in 2021, the second fastest rate in the past five years. Collectively, platforms turned a profit of £200m (2020: £190m) on their revenue of £1714m (2020: £1550m) , a pretax margin of just over 11%.


This year, the music stopped...
Parmenion was rumoured to be looking for a new buyer, at a whooping £400m valuation, four times what the PE firm Preservation Capital paid for it only 18 months ago. Caledonia was also reported to be looking to offload 7IM, again at a valuation of £400m, a few months after it rejected a £300m bid from Brooks Macdonald.
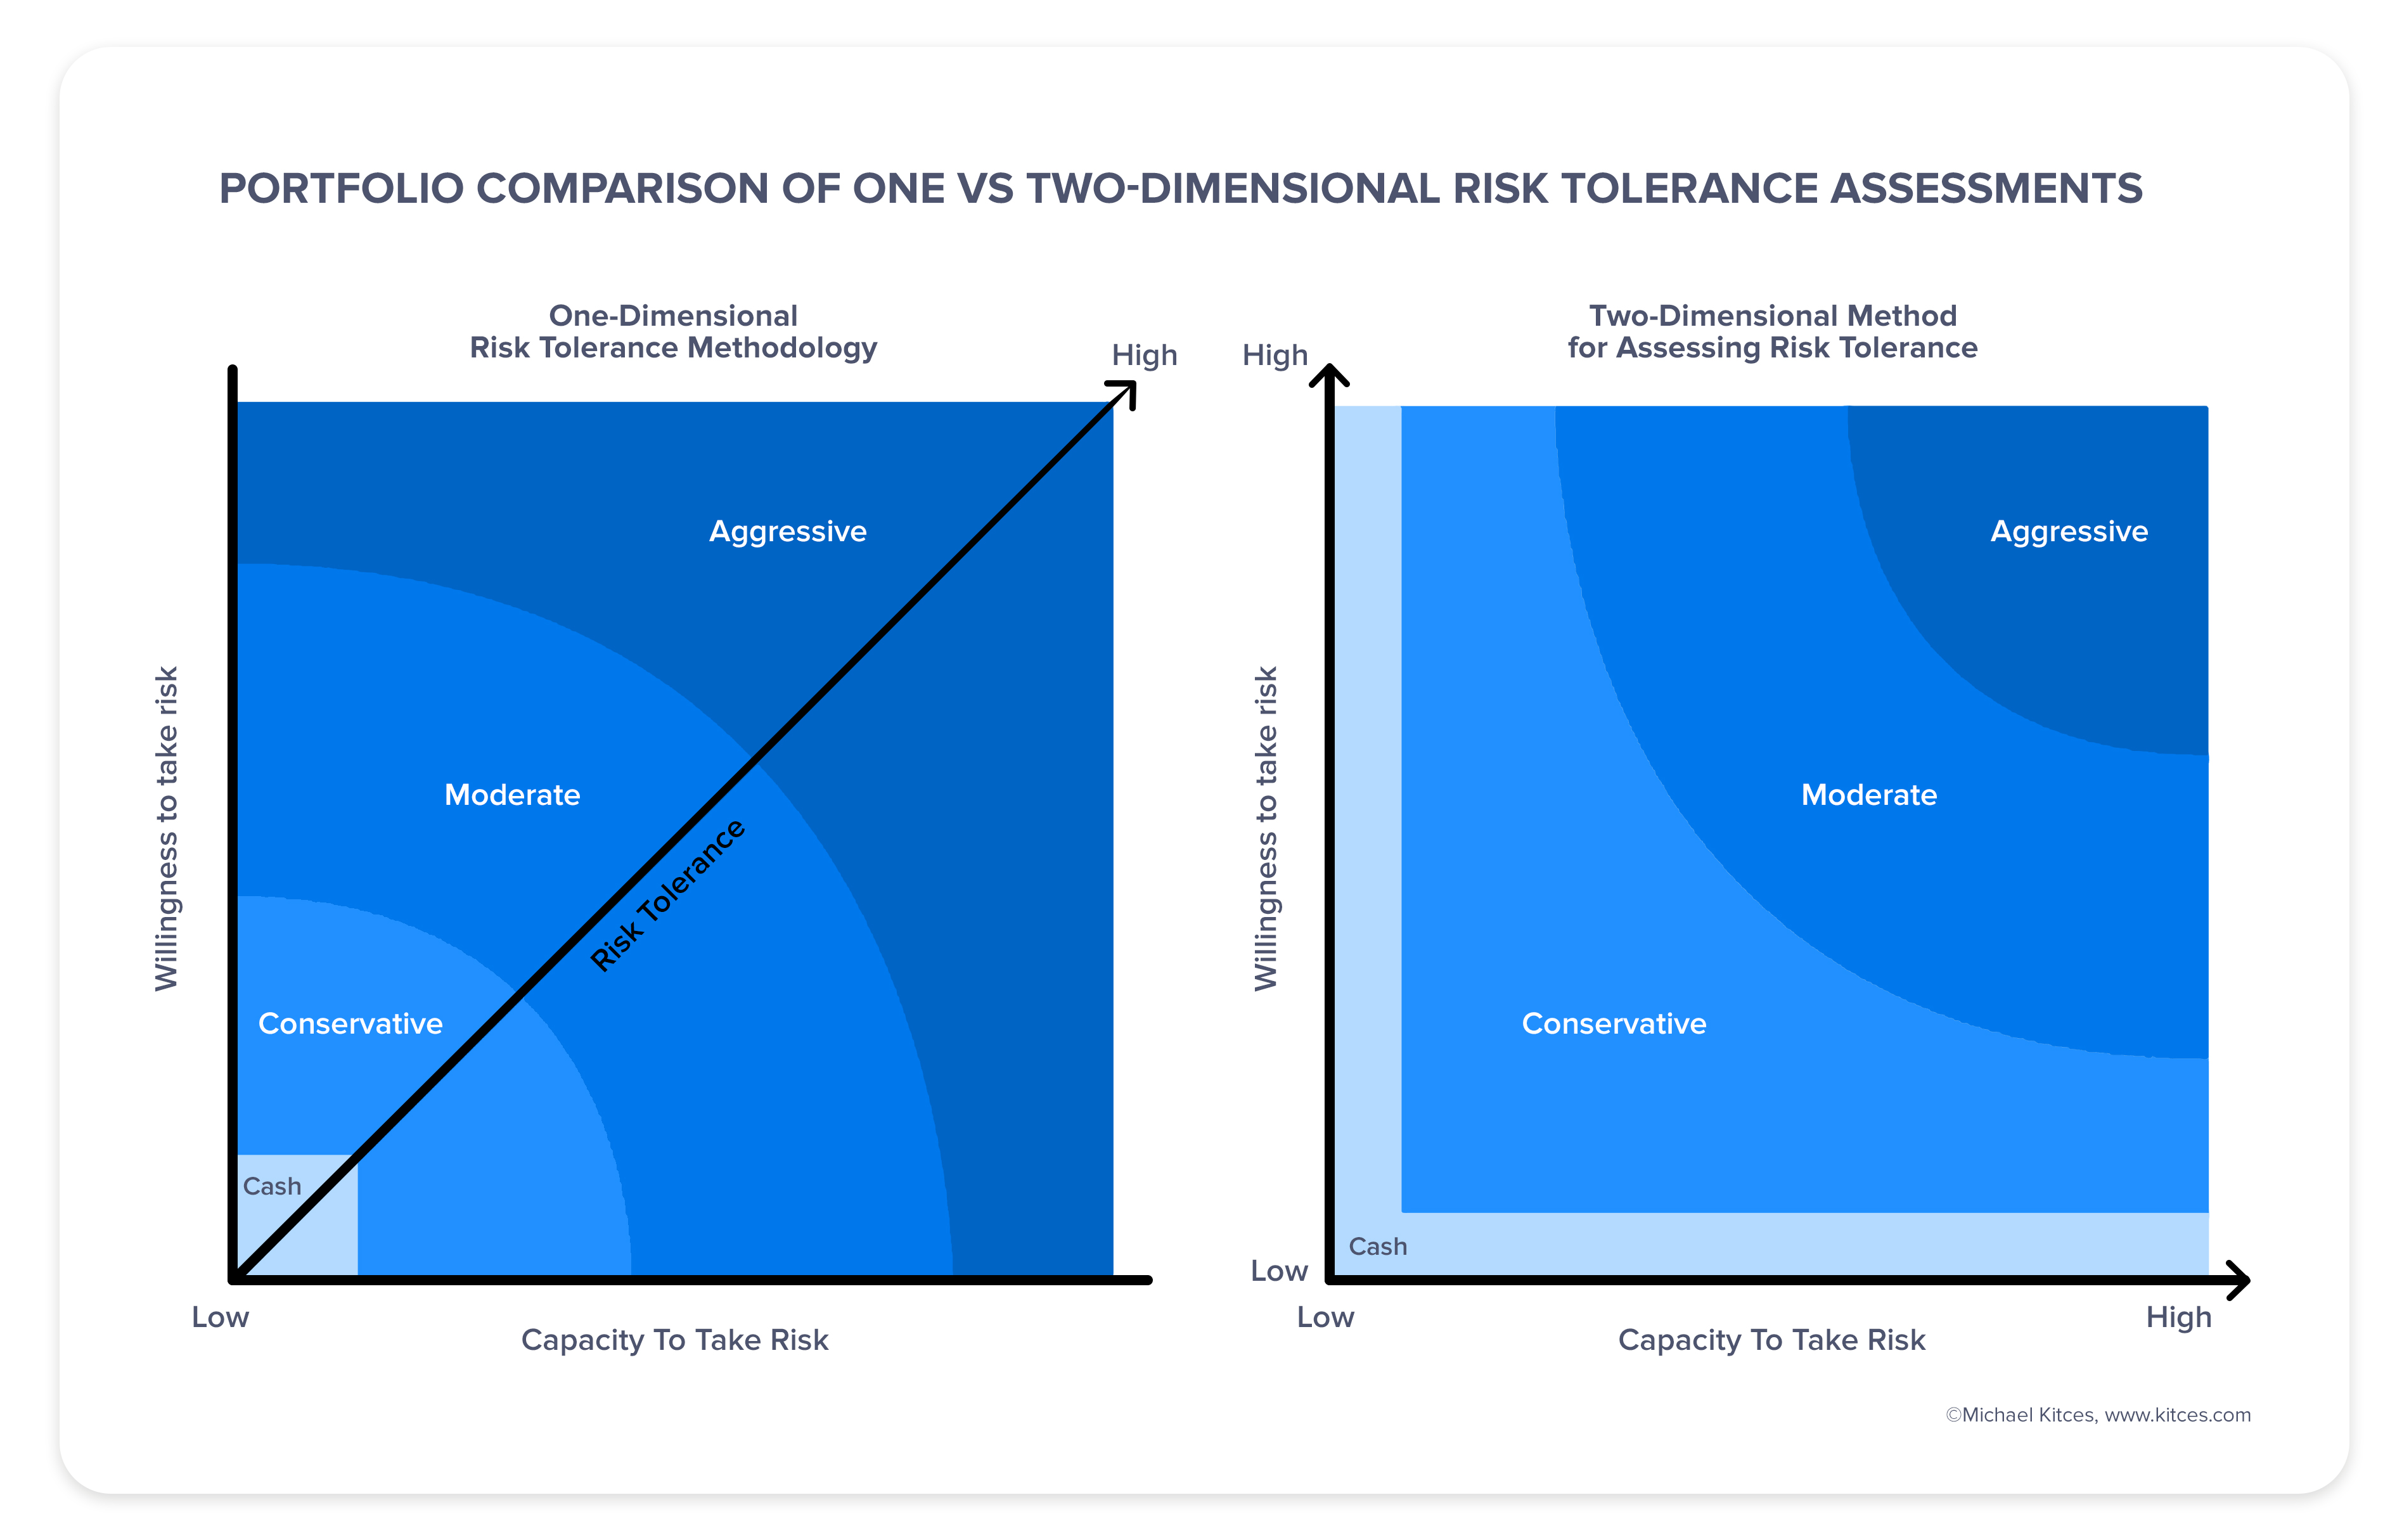
Calculating capacity for loss properly
Risk profilers typically tend to try to measure Capacity for Loss by asking questions about the stability of your income sources, but those in supposedly 'stable' jobs can one day be made redundant unexpectedly, while many self-employed people might have stable income for years.
Timeline's Risk Profiling integrates with Timeline's Financial Planner, and calculates a client's capacity for Loss based on an analysis of how their financial plan would fare across hundreds of scenarios from 120 years of history.