Timeline Charts 2023

Going back to 1926 to show how inflation, cash, bonds, property, gold, equities and portfolios fared under a wide range of market conditions.

Timeline Charts 2023

Going back to 1926 to show how inflation, cash, bonds, property, gold, equities and portfolios fared under a wide range of market conditions.

Artboard 2

ADVISERS, IT'S YOUR TIME TO SHINE!

Amidst all the uncertainty, financial advisers have a crucial role to play in providing guidance and reassurance to their clients.

During a bear market is where advisers can step in to provide much-needed perspective and help their clients make informed decisions. By taking a long-term view and reminding clients of the importance of staying invested, advisers can help to ease fears and prevent impulsive actions that could ultimately hurt their portfolios.

This however can be an opportunity for advisers to showcase their expertise and add value for their clients. By keeping a close eye on market trends and identifying areas of potential growth, advisers can help their clients to capitalize on opportunities and position themselves for success when the market eventually recovers.

In short, while the current market downturn may be cause for concern for many clients, it is also a chance for advisers to demonstrate their value and provide the guidance and reassurance that their clients need to weather the storm.

10+ Charts

Gain access to all charts, including summarised content.

Historical Data

We use empirical data going back from 1926 to the modern day.

Visually Compelling

See how portfolios fared under a wide range of market conditions.

Results From Major Events

From bull and bear markets, recessions, and political parties.

Colourful Perspective

On how wealth compounds in various asset classes and portfolios over time.

Join Our Webinar

On Thursday 27th April 13:00 PM, we're hosting our annual Timeline Charts webinar, in which we discussed the core points of the charts. You'll also find out how to get your copy!

Artboard 4

Watch RECAP

On Thursday 27th April we hosted our annual Timeline Charts webinar, in which we discussed the core points of the charts.

Artboard 4

Ready to download?

TIMELINE’S GOT YOUR BACK!

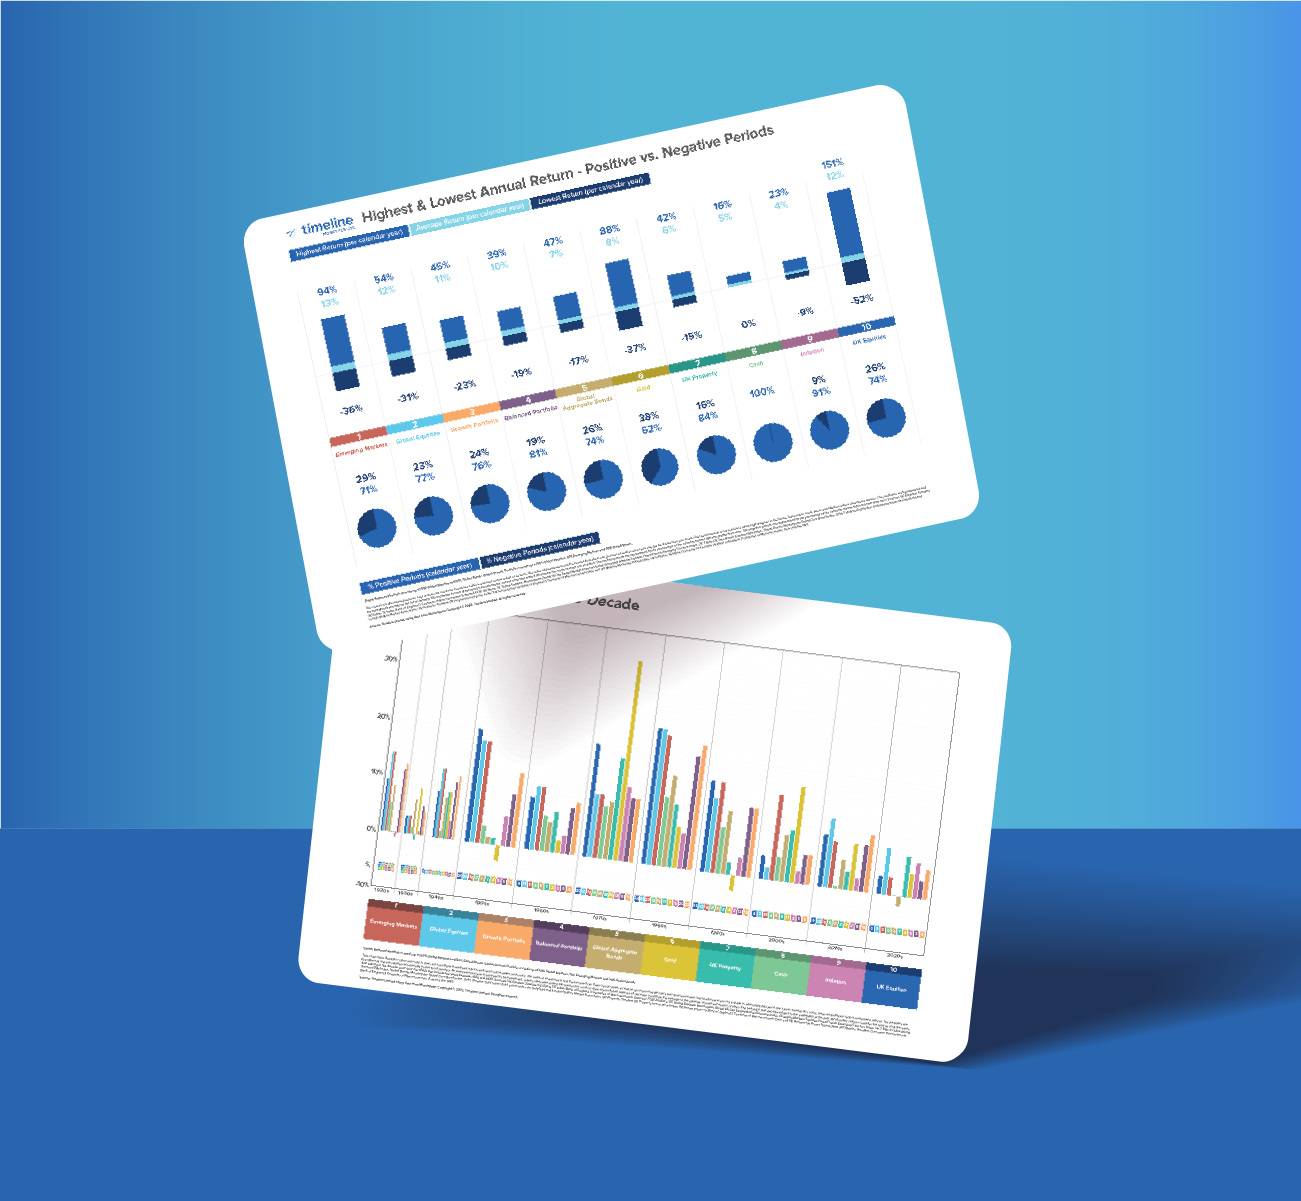
The Timeline Charts uses empirical data going back to 1926 to show how inflation, cash, bonds, property, gold, equities and portfolios fared under a wide range of market conditions.

Artboard 5
Artboard 5 copy

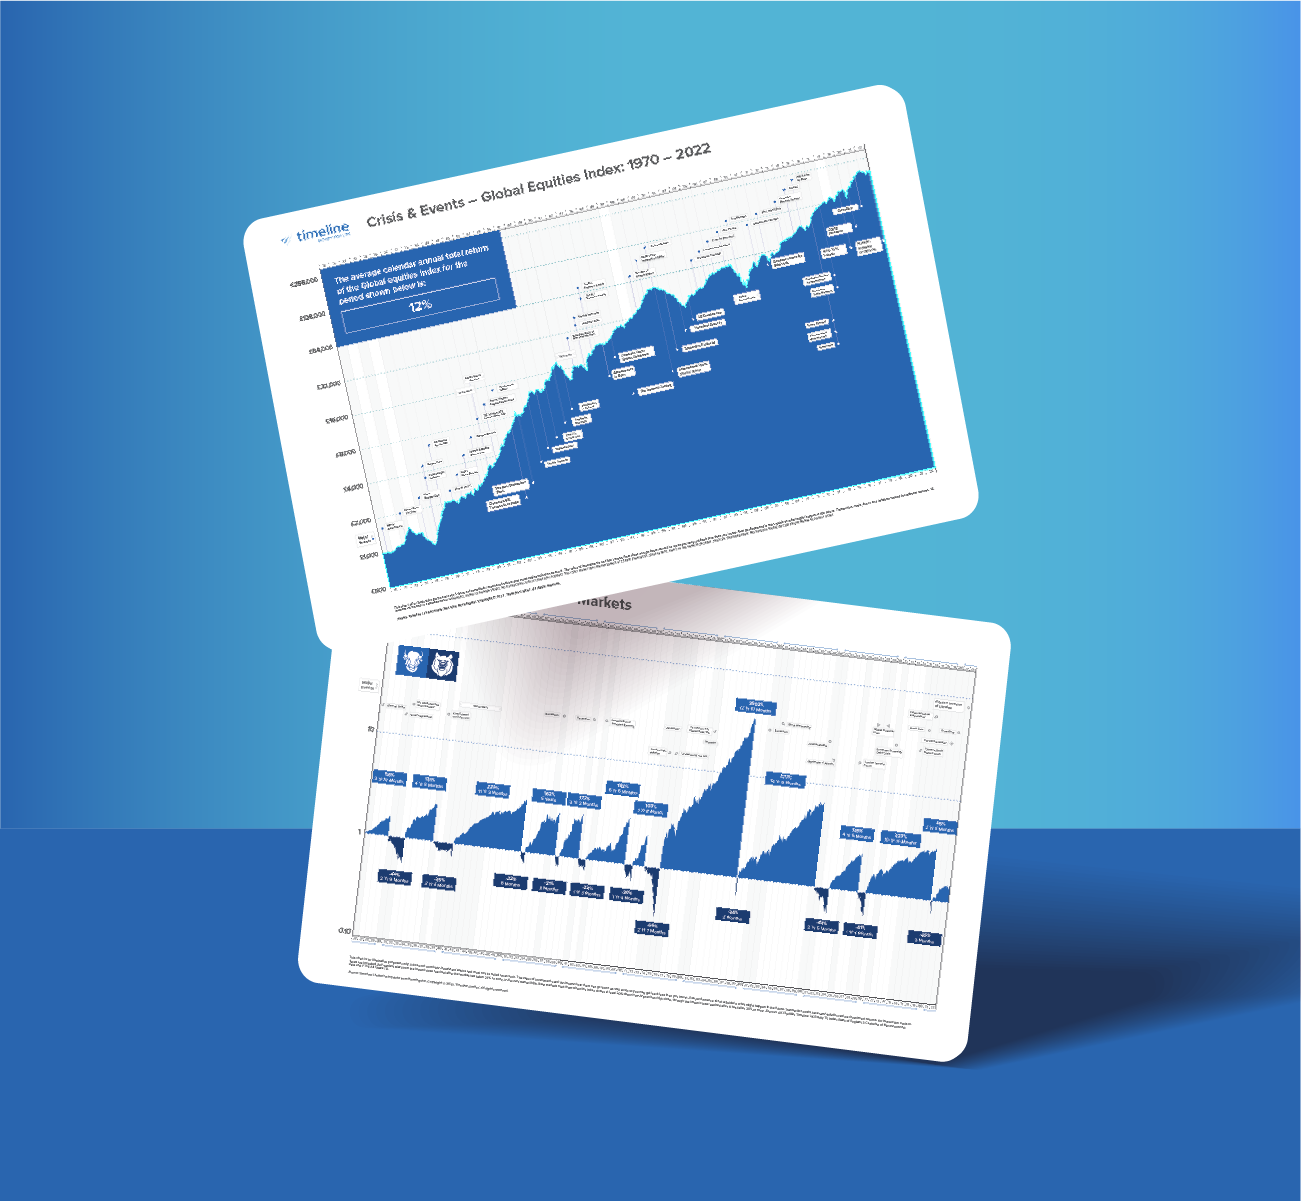
VISUALISING BULL AND BEAR MARKETS

From bull and bear markets, recessions and major events, to political parties and prime ministers/presidents, Timeline chart provides a colourful perspective on how wealth compounds in various asset classes and portfolios over time.

Timeline Charts 2023

Going back to 1926 to show how inflation, cash, bonds, property, gold, equities and portfolios fared under a wide range of market conditions.

Timeline Charts 2023

Going back to 1926 to show how inflation, cash, bonds, property, gold, equities and portfolios fared under a wide range of market conditions.